Experiment 1
Date of the lab: 10/25/21
Lab partners: Emmy, Elle
A definition of the problem and selection of variables
Research Question
: How does changing net force on a system affect acceleration of the system?
dependent variable
: acceleration of the system
independent variable
: net force on the system
control variable
- Total mass of the entire system stays constant
(Total mass of the entire system must stay the same. We are measuring how net force on the system changes the acceleration. Since F = ma, changing the total mass of the system will affect both F and a. We kept the total mass of the system the same throughout the lab by removing mass from cart to the hanger.)
- We used same track, hanger, and the cart for each trial
(Using different track might affect the value of force because of different coefficient of friction. In addition, same hanger and the cart are used to keep the total mass of the system the same.)
A developed method for the collection of data
As mentioned above, total mass of the entire system was kept constant by removing mass from cart to the hanger rather than adding new mass to hanger.
The procedure
1. Measure mass of cart, hanger, hanging masses to get total mass of the system
2. Using Logger-Pro and a motion sensor, collect data to obtain velocity vs time graph
3. Release cart with its initial velocity 0 m/s, and let motion sensor collect data
4. Calculate acceleration by analyzing velocity vs time graph. Acceleration would be the slope of velocity vs time graph
5. Repeat 3-4 for different hanging masses WHILE KEEPING THE TOTAL MASS CONSTANT
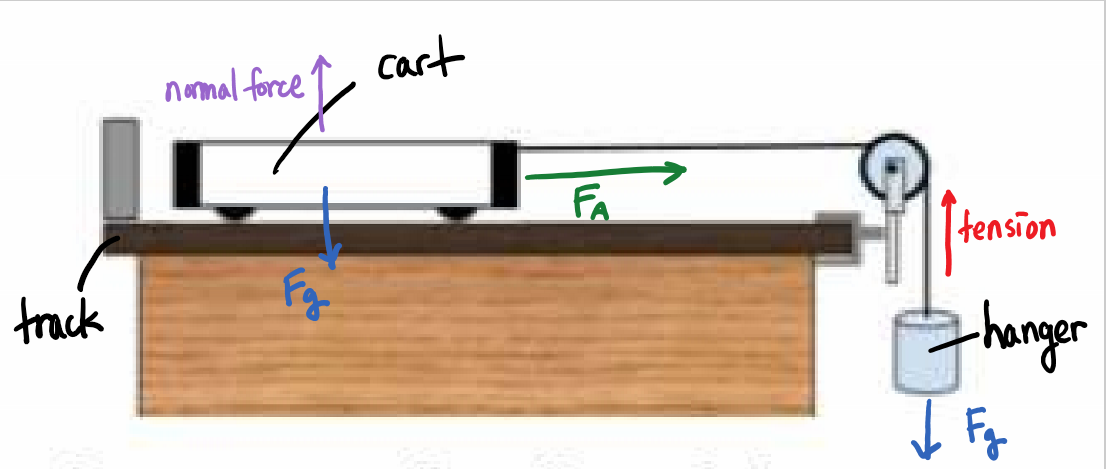
A labeled diagram
Lab partners: Emmy, Elle
A definition of the problem and selection of variables
Research Question
: How does changing net force on a system affect acceleration of the system?
dependent variable
: acceleration of the system
independent variable
: net force on the system
control variable
- Total mass of the entire system stays constant
(Total mass of the entire system must stay the same. We are measuring how net force on the system changes the acceleration. Since F = ma, changing the total mass of the system will affect both F and a. We kept the total mass of the system the same throughout the lab by removing mass from cart to the hanger.)
- We used same track, hanger, and the cart for each trial
(Using different track might affect the value of force because of different coefficient of friction. In addition, same hanger and the cart are used to keep the total mass of the system the same.)
A developed method for the collection of data
As mentioned above, total mass of the entire system was kept constant by removing mass from cart to the hanger rather than adding new mass to hanger.
The procedure
1. Measure mass of cart, hanger, hanging masses to get total mass of the system
2. Using Logger-Pro and a motion sensor, collect data to obtain velocity vs time graph
3. Release cart with its initial velocity 0 m/s, and let motion sensor collect data
4. Calculate acceleration by analyzing velocity vs time graph. Acceleration would be the slope of velocity vs time graph
5. Repeat 3-4 for different hanging masses WHILE KEEPING THE TOTAL MASS CONSTANT
A labeled diagram
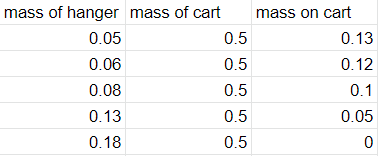
Recorded Raw Data
mass in kg
mass in kg
Processed Raw Data
mass in kg / net force in N / acceleration in m/s^2
mass in kg / net force in N / acceleration in m/s^2
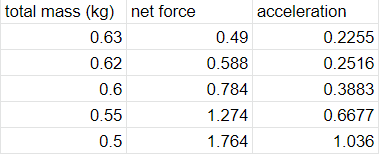
1. Total mass = mass of cart + mass on cart
0.63kg = 0.5kg + 0.13kg
2. Net force = mass of hanger x 9.8
0.49N = 0.05kg x 9.8 m/s^2
3. Acceleration
The motion sensor was used to obtain Velocity vs time graph. The acceleration was the slope of velocity vs time graph for each trial. The acceleration or the slope was automatically calculated by the computer for each trial.
Presentation of Processed Data
Graph
Graph
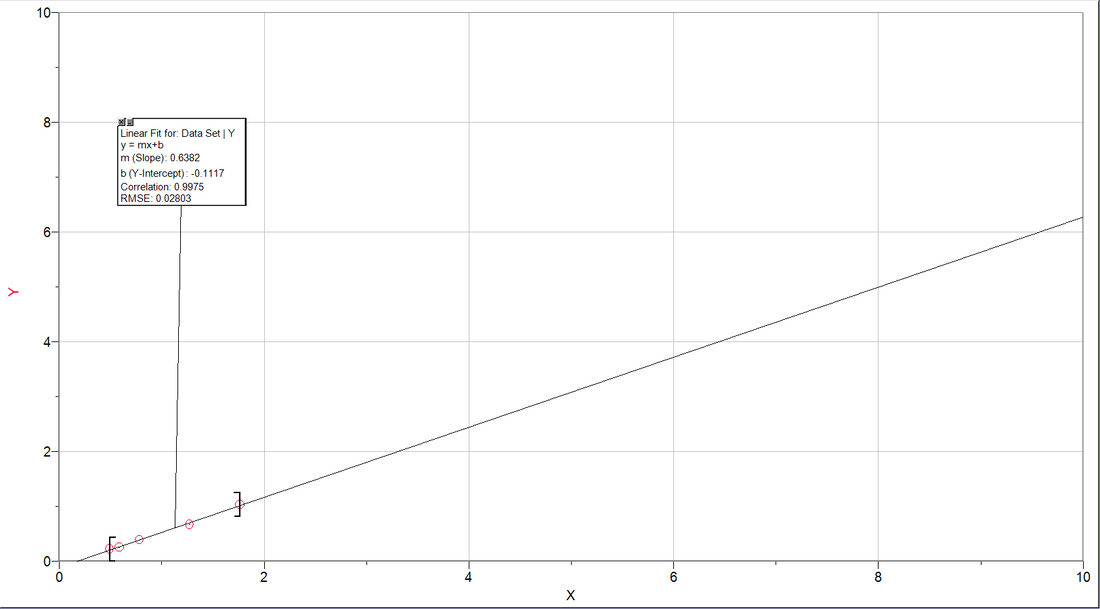
graphical analysis
X = Force (N)
Y = Acceleration (m/s^2)
y = 0.6382x-0.1117
Therefore, acceleration = (slope)(Force) + y-intercept
slope = 0.6382 --> The slope indicates that every 1N increase in Force will increase the acceleration by 0.6382 m/s^2
Y-intercept : -0.1117
Y-intercept should have been 0 if we performed our lab perfectly. Since our value deviates from 0, there must have been error or uncertainty involved with our group's lab performance
Addressing the purpose of the lab
Results of the lab or the graph of the A vs F graph shows that acceleration and force of the system are directly proportional. The graph shows a positive linear relationship between the two variables.
Conclusion
The lab was performed to verify Newton's second law. (Force = mass x acceleration) While keeping the total mass of the system constant, Force and acceleration of the system showed directly proportional relationship. It means that increasing force will increase acceleration of the system.
Evaluating Procedures
we used 5 data points for our lab. If we used more data points or greater range of data, we might have gotten better results. For instance, Y-intercept could have been calculated closer to 0 if we used a larger amount of data.
Improving the Investigation
As mentioned above, a larger range of data should have produced more accurate results. We only used 5 data points. Using 10 or even 20 data points would have been definitely better. In addition, while calculating the Force (N) in processed data, we multiplied the mass by 9.8 m/s^2. Multiplying 9.81 m/s^2 would have produced a better result.
Experiment 2
Date of the lab: 10/25/21
Lab partners: Emmy, Elle
A definition of the problem and selection of variables
Research Question
: How does the acceleration of an object depend on the mass of it?
dependent variable
: acceleration
independent variable
: total mass
control variable
: We need to keep the net force constant
The net force of the entire system stays constant
(The net force of the entire system must stay the same. We are measuring how acceleration of the system depends on the mass. Since F = ma, changing the net force of the system will affect both m and a. We kept the net force of the system the same throughout each trial.
- We used same track, hanger, and the cart for each trial
(Using different track might affect the value of force because of different coefficient of friction. In addition, same hanger and the cart are used to keep the total mass of the system the same.)
A developed method for the collection of data
The net force will influence the acceleration of the object. The net force must be kept constant. After setting the net force constant, we may change mass by adding masses to the cart.
The procedure
1. Measure the net force (calculated with mass of hanger)
2. Using Logger-Pro and a motion sensor, collect data to obtain velocity vs time graph
3. Release cart with its initial velocity 0 m/s, and let motion sensor collect data. Also, record total mass of the system.
4. Calculate acceleration by analyzing velocity vs time graph. Acceleration would be the slope of velocity vs time graph.
5. Repeat 3-4 for different masses WHILE KEEPING THE NET FORCE CONSTANT
A labeled diagram
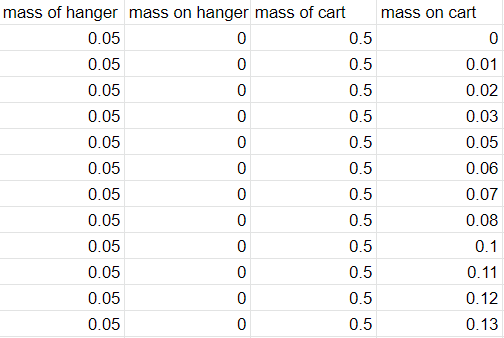
Recorded Raw Data
mass in kg
Mass of hanger x 9.8 = net force
0.05kg x 9.8m/s^2 = 0.49N
mass in kg
Mass of hanger x 9.8 = net force
0.05kg x 9.8m/s^2 = 0.49N
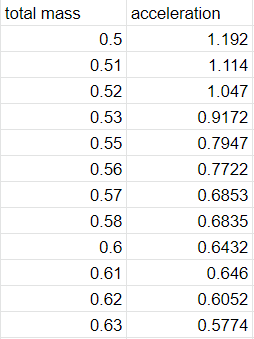
Processed Raw Data
mass in kg / acceleration in m/s^2
mass in kg / acceleration in m/s^2
total mass = mass of cart + mass on cart
trial 1) 0.5kg = 0.5kg + 0kg
trial 2) 0.51kg = 0.5kg + 0.01kg
acceleration
The motion sensor was used to obtain Velocity vs time graph. The acceleration was the slope of velocity vs time graph for each trial. The acceleration or the slope was automatically calculated by the computer for each trial
Presentation of Processed Data
Graph
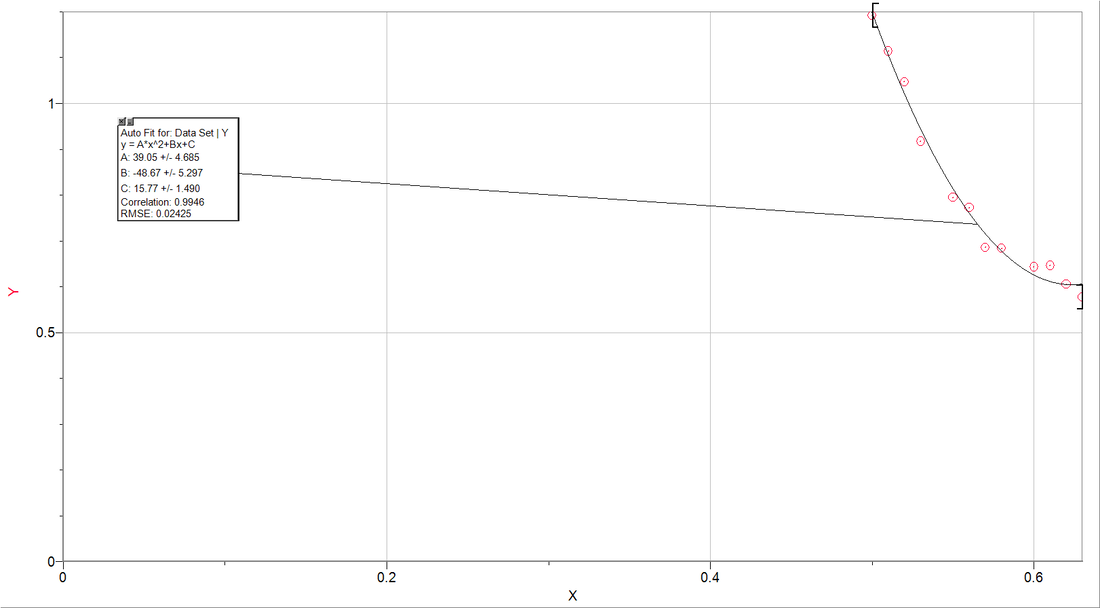
Graphical analysis
X = mass (kg)
Y = acceleration (m/s^2)
y = 39.05x^2-48.67x+15.77
The graph shows an inversely proportional relationship between mass and acceleration. If the mass increases, the acceleration gets decreased.
The slope = Since the model is quadratic, there is no slope for the equation. However, the overall graph definitely suggests an inversely proportional relationship between the mass and acceleration
Y-intercept : There cannot be a Y- intercept for this lab. The total mass cannot be 0 because the hanger has a mass of 0.05 kg. The minimum mass is 0.05 kg for this lab.
Addressing the purpose of the lab
Results of the lab or the graph of the mass vs. acceleration graph shows mass and acceleration of the system are inversely proportional. The graph shows a inversely proportional relationship between the two variables.
Conclusion
The lab was performed to verify Newton's second law. (Force = mass x acceleration) While keeping the net force of the system constant, mass and acceleration of the cart showed inversely proportional relationship. It means that increasing the total mass will decrease acceleration of the system.
Evaluating Procedures
We used 12 data points for our lab. If we used more data points or greater range of data, we might have gotten better results. For this particular lab, we completely neglected an air resistance and frictional force produced by the track. If we were able to calculate air resistance force and frictional force produced by the track, we would have certainly gotten a better result.
Improving the Investigation
As mentioned above, a larger range of data should have produced more accurate results. We only used 12 data points. Using 20 or even 30 data points would have been definitely better. As mentioned above in the evaluating procedures, calculating and taking air friction force and frictional force produced by the track into account would have produced more accurate data.
